|
TennisOne Lessons
A Quantitative Analysis of WTA Doubles: Part I Rush the Net or Stay Back? Doug Eng EdD, PhD In recent years, the face of professional doubles has changed. Particularly on the WTA Tour, we have seen new styles of play apart from the traditional serve-and-volley. Some analysts have suggested that ineffective volleying is the main reason for staying back at the baseline. In this study, I will offer an alternative: that modern tactics and service placement lead to the modern one up, one back game, which I will refer to as the up-back style. In addition, I will show that volleys are the still the most important shot to win. In this first part, we will examine the effectiveness of net play, of two at the net and of the up-back style.
Dont let the title quantitative analysis intimidate you! All those stats including percent first serve in and winners are, in fact, quantitative analysis. I will keep it visually simple so everyone can understand. This study involved 549 points from eight matches on hard courts from 2003 to 2006 with sixteen different WTA players exhibiting serve-and-volley, all-court and baseline styles. The players included Martina Navratilova, Alicia Molik, Svetlana Kuznetsova, Kim Clijsters, Ai Sugiyama, Virginia Ruano Pascal, Paola Suarez, Conchita Martinez, Tiantian Sun, Ting Li, Elena Dementieva, Anke Huber, Tamarine Tanasugarn, Janette Husarova, Anna-Lena Groenefeld, and Daniela Hantuchova. Why Do Women Professionals Stay Back? There is no doubt that todays WTA pros often stay back at the baseline after serving. There remain a few players who rush the net more consistently but most servers and receivers prefer the baseline. In this study, only 3.6%(!) of the total points were ended with all four players at or inside the service line. So it really doesnt make much sense for the WTA pros to prioritize practice time with four players at the net. In contrast, recreational players frequently practice the classic mixer drill with all four players at the net or service line. Ask yourself, in your matches, how often are all the players at the net? Chances are, you might have more net time than the pros if you are an experienced adult player. A junior team might find themselves at the net together less frequently. Some television commentators suggest that todays pros stay back because they have relatively weak volleys. Even at Wimbledon, the game has moved away from the serve-and-volley game. Amelie Mauresmo showed us at Wimbledon last year, that there is still hope. But in doubles, you have less court to cover so perhaps the serve-and-volley is more viable than in singles. If volleys are not good enough at the pro level, we might hypothesize that percentages should not favor the serve and volley.
Table 1 compares when the server rushes the net or stays back. In all examples, the service return was good which neutralizes the effect of both serve and return. In the first four lines -- in green -- statistics on the server coming in are shown. On the first serve, the server has a 55-56% chance of winning the point if she gets to the net and plays a volley, overhead, half-volley or any other shot. On the second serve, shown in light green, her percentages drop to 42-47%. The sampling is small for second serve net-rushing so there is statistical uncertainty but still the percentages are lower than for the first serve. Perhaps, on the second serve, it is not wise to serve and volley. On the first serve, going to the net clearly favors the server. The alternative of playing a groundstroke is shown in red in Table 1. On the first serve, the server has a 40.7% chance of winning the point if she gets her first serve in and plays a groundstroke. If she does the same on the second serve, her chances appear slightly greater at 46.1% but this difference is not statistically significant. On the second serve, it appears that staying back (46.1%) is more effective than closing in to volley (42.9%) but again this difference is not statistically certain (within 90% confidence). Basically on the second serve, there appears to be no statistical difference between closing in to volley and staying back to play a groundstroke. So it can be advised that WTA pros can stay back on the second serve. In Part II, however, we argue that volleying might possibly be a better choice on the second serve. On the first serve, there is a statistically significant difference between coming in to volley (55.9%) and staying back (40.7%). Ironically, the pros are 2.67 times more likely to stay back than volley. I cant offer a rational reason but I would guess that the pros may be acting on comfort level at the baseline as opposed to acting on rational percentages. It is not unlike the gambler who bets because she feels lucky rather than playing the mathematical odds. Indeed it is a very human behavior. On the blue, light blue and violet lines, statistics are shown for when the servers partner plays a volley. In blue is the situation for when the server stays back and the partner volleys. The success rate was quite high at 72-73% for this pattern on both the first and second serve. In light blue, the server comes in and the partner volleys. The percentages are lower (50-65%) but the sampling too small (frequency = 4.7-5.0%) to suggest a statistical difference. In violet, the servers partner volleys without making a poach (68-76%). That means the return (e.g., down-the-line, at the net player, or ineffective lob returns) must be reachable by the net player without poaching. The percentages are 76.1% for the first serve and 68.2% for the second serve for this situation. In the green and red data lines, the returns were generally crosscourt and winning percentages were lower. Comparing all data, one can conclude that crosscourts are generally the best return. Combining all these statistics generally indicate that the team that makes the first volley has a 55-75% chance of winning the point. Hence, the WTA pro who stays back on the serve and plays a groundstroke is giving up the initiative and allowing her opponents to make the first strike. If she stays back on the serve, chances are unlikely that she will ever go in but instead will give several chances for the opponents to close in or poach. Of course, these statistics vary for the individual player. Regardless, we can make a strong case for getting in the first volley. The first volley is extremely important even if the volleys are relatively weak. Therefore, the recommendation is for WTA pros to mostly serve-and-volley on the first serve. On the second serve, it appears that pros may choose to stay back or come in since they seem to produce similar results. However, in Part II, a deeper examination of serves will produce some interesting results. How Important Is Good Net Position? Traditional tennis theory regards two players at the net as the best winning combination provided most lobs can be covered. Proximity to the net theoretically offers more chances to play the winning shot. To test this theory, lets look at the location and type of winning or losing shots.
Table 2 shows the general location or court positioning. Aces, service winners, and errors on the return are not included. Lets define 4 basic positions: N = within 18 feet of the net, S= within 2 feet of the service line, I = more than 2 feet behind the service line and inside the baseline, and B = at or behind the baseline. S is a narrow (4 ft) infrequent zone and few players stand in zone I as shown in Table 2 so the frequency of winners and errors are less for S and I. The last statistic, % Ending Shot refers to the frequency of total winners and errors. It can be seen, win or lose, that 47.8% of the points ended at the net. The W/E ratio refers to the winners/errors ratio which measures the effectiveness of the court position. The more winners to errors, the higher the value of W/E. Sloppy play results is a low W/E. The W/E ratios confirm what we already know: getting to the net is much more likely to win you points rather than hanging out at the baseline. Second, lets break down the type of shots on which the pros might win or lose. Table 3 shows the types of winners and errors. In green are the shots that win more often than lose. In red are the shots that lose more often than win.
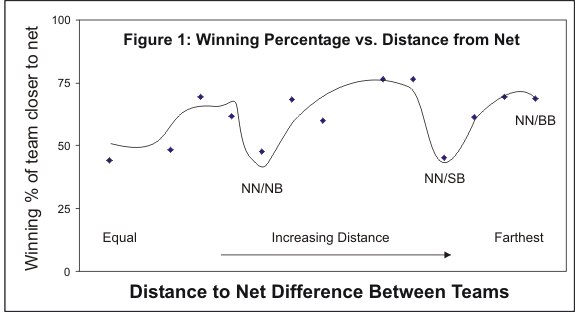
Five basic shots volleys, overheads, and groundstrokes --made up 96% of the decisive ending shots. The only shots that had more winners than errors were volleys and overheads (shown in green). Overheads were most decisive with a winners outnumbering errors almost 10 to 1 (W/E = 9.6). There was a clear difference between forehand and backhand volleys. Forehand volleys were clearly (and statistically) superior with W/E = 1.91. Perhaps WTA pros should be trying to set up forehand poaches more often. Backhand volleys only produced marginally more winners than errors. Most of the players had two-handed backhands and -- even if volleying one-handed -- may feel less confident or may be less skilled with the backhand volley. It would be interesting to directly statistically compare the one-handed and two-handed backhands but those results were not recorded in this study. Not included in Table 3 were returns of serves. For the same reason, serves were not included to eliminate the effect of the serve and return. However, if you are curious, the returns had W/E = 0.17 and there was no statistical difference between the forehand and backhand returns. That ratio is significantly lower than that for groundstrokes (0.34 to 0.44). Despite the notion that the modern groundstrokes are very big, they do not produce more winners than errors. Volleys and overheads at the net are still the shots that win most often. Is Two Up Better than One Up and One Back? Considering that volleys and overheads clearly win more points than groundstrokes, we might ask whether two at the net is better than the up-back formation. To this end, lets look at the positioning of doubles teams. Figure 1 shows a plot of winning chances versus the difference in distance (and formation) from the net between the two teams. The percentage (i.e., vertical axis) is that of the team closer to the net. When teams are equal distance from the net, the winning percentages are about 50% (see left end of plot). For example, all four players could be at the net. Or all four players could be at the baseline. Or both teams could have one player at the net and the other at the baseline. The overall difference in distance from the net for the teams is equal and often symmetric. At the right end, the difference in net position is greatest; one team is at the net (NN) and the other is at the baseline (BB). I use the notation NN/BB for this position.
In Figure 1, as the difference in distance increases, the percentages of winning generally increase with the exception of two minima. As mentioned before, the percentage is that of the team closer to the net. Since the percentage is never really much below 50%, we can say that the closer team generally always has the better winning chances. These two minima comprise the formations NN/NB and NN/SB: two players at the net (N) against a baseliner (B) and a partner at the net (N) or at the service line (S). All other percentages, typically 60-75%, (with the exception of the left end of the plot) clearly favor the team closer to the net. With the minima that include the NN/NB and NN/SB positions, the winning percentages were about 47% and 45%, respectively. Note, they cannot be shown to be statistically confidently below 50% (31 out of 68 points won by the team at the net). But the message is clear: some net advantages can be neutralized. Why? Are volleys weak? Are groundstrokes too big? One might also ask, why is there an increase between these two minima? Those positions might be two players at the net against one at the net and the other inside the baseline (NN/NI where I=inside the baseline). Often these intermediate positions may involve one player in a slightly awkward position such as a bit behind the service line. What is statistically demonstrated is that the well-positioned up-back (BN or BS) formation can neutralize two at the net (NN). If the baseliner hits an effective shot with pace and topspin, often the net team has some difficulty with the volley. If the volley is not well executed, the baseliners partner at the net or service line can step in and play a forcing volley. In effect, this pick-off move is similar to a poach where the server forces a weak ball from the receiver. It is important to note that the groundstroke is a set-up shot, not the winning shot. The winning shot is still the volley. But like the serve-and-volley, the crush and pick-off can be an effective 1-2 punch against a team at the net.
Two baseliners versus two net players, however, were not effective. The net team was favored to win 69% (see Figure 2). If one baseliner rips a groundstroke at the net players, there is no partner at the net to pick off a loose volley. Therefore, it seems that the up-back formation does have a purpose against two net players. Against two at the net, the baseliner should often hit crosscourt as the down-the-line is usually the weaker shot. In this study, the team with two net players (against any other formation) won only 52.9% of the points (out of 119 points). With two net players against a team with a baseliner and the partner at the service line, the latter team won 59% of the points! That means the net team only won 41% of the points. Figure 2 graphically shows these percentages. How much truth is in these statistics? There is some uncertainty, of course, but it does shed some doubt on whether moving together as a team is effective. The up-back has received strong criticism traditionally because if played incorrectly, it geometrically leaves parts of the court exposed. My feeling is that the most important thing is for the team to know their roles. It doesnt make sense to play two at the net if neither have good volleys or overheads. It doesnt make sense to play the up-back formation if the baseliner cant drive groundstrokes sufficiently to keep the net team honest. So regardless of what you choose to do, know your strengths and your roles well! Now also surprising is that if the net team is slightly staggered, the net team was statistically more effective. In Figure 2, that means the green P replaces the red P. Then the overall winning percentage actually increases from 51% to 69% (for any and all team formations in Figure 2). Is a slightly staggered net position really better than two evenly placed at the net? Maybe part of this difference was statistical noise. A slightly staggered position, however, defines a dominant net player and allows the deeper player flexibility to volley or cover the lob. Finally, during a rally, as we already earlier mentioned, two at the baseline does not seem to be effective. Off a serve, the two-back formation won 37.3% (of 161 points) of the time but this low percentage may largely be due to already strong serves. At the pro level, two-back is clearly not a winner. Conclusions for Part I We have seen evidence that two at the net or two at the baseline may not be the best way to win points. Although it allows the players to form a wall for coverage, it assigns them the same roles and may not be the best answer when the position requires flexibility. The up-back formation statistically does have its advantages and can neutralize two at the net. On the first serve, WTA pros should strongly consider coming in to volley as statistics show that is their best chance to win. The first volley is critical for winning the point, whichever team makes the shot. In Part II, we will examine the use of serves, returns, and poaches. Your comments are welcome. Let us know what you think about Doug Eng's article by emailing us here at TennisOne.
Doug Eng EdD PhD coaches men's tennis at Tufts University. During the summer, he directs at the Tennis Camps at Harvard. He has received divisional Pro of the Year honors from the PTR and USPTA and several national award. Doug completed the USTA High Performance Coaches program and frequently runs educational and training programs for coaches. Doug also writes and speaks on tennis and sport science. |
|||||||||||||||||||||||||||||||||||||||||||||||||||||||||||||||||||||||||||||||||||||||||||||||||||||||||||||||||||||||||||||||||||||||||||||||